Specifying the plot size
You can use the height hint and width hint settings to suggest a minimum height and width for the plot. In most cases, BIRT Report Designer uses the values you supply to size the plot. If you set a plot size that is too large to fit in the total design space, or if other chart elements such as the legend or a title are too large to accommodate the suggested plot size, BIRT Report Designer ignores the settings.
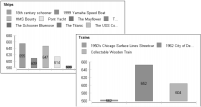
A height or width hint is most useful in a report that uses multiple charts, such as a report with different chart elements or a report that includes a chart element in a group section. Because chart sizing is dynamic, one chart element can produce multiple charts with plots of different sizes, as shown in
Figure 17‑61.
Figure 17‑61 Charts created not using a height hint
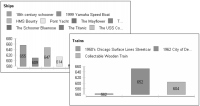
Height and width hints help you to regulate the plot sizes in a group of charts. For example, the illustrations in
Figure 17‑62 show that charts using a value for the Height Hint setting maintain the same height.
Figure 17‑62 Effect of setting a height hint
The following procedures describe how to set the background color for a plot and how to include an outline or shadow and make adjustments in the size and placement of the chart.
To set a background color for the plot, navigate to the Plot section of Format Chart, shown in
Figure 17‑63. Choose Background for either Area Including Axes or Area Within Axes, then use the color picker to select a background color. To apply the color to the plot, choose Finish.