A report is often more useful when you display information in graphical format, such as in a chart. Interactive Crosstabs enables you to easily present an alternative view of the same information, making the information visually compelling and highlighting key information at a glance. In Interactive Crosstabs, data is presented as a grid in tabular format and as a chart. For every cross tab you create, the default chart type generated is a column chart. You can edit the chart type to select from a range of supported charts that are best suited to present your data. You can also modify the data selected for the chart. Interactive Crosstabs supports the same chart types as Interactive Viewer.
Displaying a chart
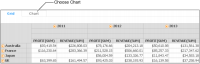
In Interactive Crosstabs, in the structure pane, choose Chart, as shown in Figure 10‑32.
Figure 10‑32 Choosing the chart view
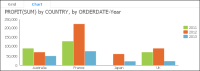
A column chart appears as shown in Figure 10‑32, displaying data from the cross tab shown in Figure 10‑33. The chart displays the profit values for Australia, France, Japan, and the UK for three years.
Figure 10‑33 Displaying cross tab data in a column chart
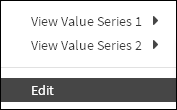
The profit totals are plotted on the y‑axis of the chart. Because the cross tab displays values for the Profit and Revenue measures, or multiple value series, you can use the chart’s context menu to select either value series or display data for both series in the same chart. Right‑click the chart to view the available options.
Modifying a chart
You can modify a chart to change its appearance and the data it displays. For more information about modifying a chart, see Modifying charts.
How to choose a chart type
1 In Interactive Crosstabs—Chart, right-click a chart and choose Edit, as shown in Figure 10‑34.
Figure 10‑34 Choosing Edit
Chart Builder—Data appears.
2 In Chart Builder—Data, choose Type.
3 In Chart Builder—Type, select a chart type.
For all chart types, you must select one dimension as the category series and at least one measure as the value series. You can select two dimensions to display two value series. Then, depending on the cross tab data that a chart uses, you can group and aggregate the values to customize the chart’s appearance.
For more information about the supported chart types, see Types of charts. For more information about selecting data for a chart, see Using Report Studio.
Formatting a chart
Interactive Crosstabs provides similar formatting options for charts as Interactive Viewer. Additionally, you can customize the chart title in Interactive Crosstabs. By default, every chart displays a title using the following cross tab values and syntax:
<measure name> by <row dimension name>, by <column dimension name>
where <measure name>, <row dimension name>, and <column dimension name> are character strings that match the values in the structure pane for Measures, Rows, and Columns, respectively.
Customize the chart title by typing a new title in Chart Builder—Format.